Advanced Analysis
Advanced Analysis is the tuning workbench. It takes one metric and shows you how your system's ROI, win rate, profit and player count change as you slide that metric's threshold up and down — so you can find the number that pays best instead of guessing.
It's the most powerful screen in the tool, which is why it gets its own page.
Opening it
On the Live Matching card, click Advanced Analysis (just under the Run Full Backtest button). It's enabled once your rules match at least one player.
Choosing what to analyse
The Group by dropdown at the top picks which metric's threshold is being swept. It has two sections:
- System Rules — the metrics already in your rules. Pick one to see how moving its threshold would have changed the outcome.
- Other Metrics — every other metric. Pick one to preview a rule you haven't added yet.
Reading the table
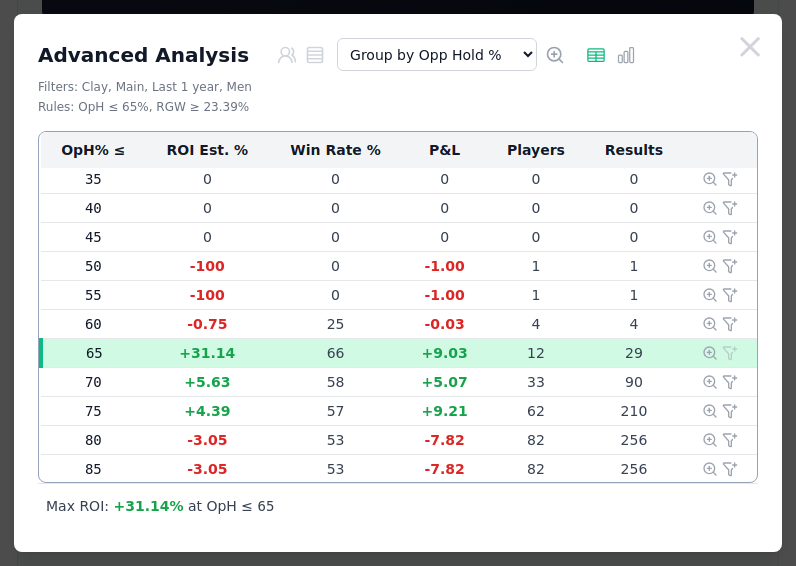
Each row is one threshold value for the chosen metric. The columns are:
| Column | Meaning |
|---|---|
| Threshold (left) | The metric value being tested (e.g. RGW ≥ 30). |
| ROI Est. % | Estimated return on investment at that threshold. |
| Win Rate % | Share of bets that won. |
| P&L | Profit or loss in points. |
| Players | How many players qualify at that threshold. |
| Results | How many historical match bets sit behind the row. |
Your current setting is highlighted in green with a green bar down its left edge, so you can instantly compare it against looser and tighter numbers. A footer line calls out the Max ROI and the threshold that achieved it.
Acting on a row
Every whole-number row has two icons on the right:
- Magnifier (zoom) — re-runs the analysis on a tight band around that threshold, so you can inspect it half-point by half-point. See Zoom below.
- Funnel-plus (apply to your system) — this is the key one: it uses that threshold in your live system. If the metric is already a rule, it updates the rule to that number; if it's a new metric, it adds it as a rule. The modal then closes and Live Matching re-checks against the new setting immediately. The icon is disabled on the row you're already using.
Workflow: scan the table for the best ROI over a believable Player/Results count, then click its funnel-plus to lock that threshold into your system.
Zoom
Zoom narrows the sweep to a range you care about instead of the full 0–100.
- Click the magnifier toggle in the header (or a row's magnifier) to switch it on. It auto-centres on the best-ROI threshold.
- The two small from – to % boxes set the exact band. Edit them and press the little refresh arrow (or Tab out) to re-run.
- Click the toggle again to clear zoom and return to the full range.
Zoom applies to both the table and the chart, so you can drill into the sweet spot with finer detail.
Table view vs chart view
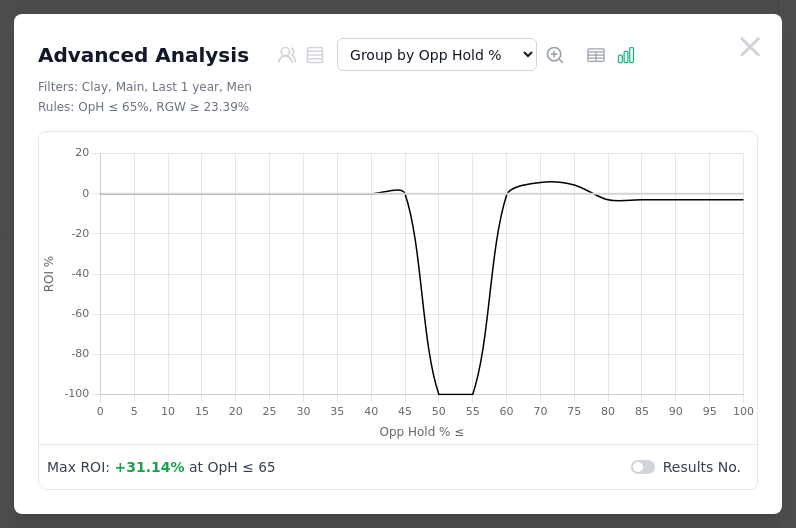
The two icons at the top-right switch between the table and a chart of ROI across every threshold — often the fastest way to spot the peak at a glance. The green baseline marks ROI = 0, so anything above it is profit.
In chart view, tick Results No. to overlay a second line showing how many matches sit behind each point — a high ROI on very few results is fragile. Zoom works here too, tightening the x-axis to your chosen band.
Jump to the lists
The two icons next to the title jump straight to the Qualifying Players list or the full Backtest Results for the current rules, without leaving your place.
Tips
| Tip | Why it matters |
|---|---|
| Look for the widest sweet spot | A threshold with ROI at both 42–48 is more robust than a spike at exactly 45. |
| Check the Results count | High ROI on 3 matches is fragile; aim for 10+ behind the best threshold. |
| Zoom near the peak | Half-point precision can matter; zoom in to see fine detail around the best ROI. |
| Compare to your current rule | Green highlight shows your current setting — see how far off the optimal is. |
Next step
Found a better threshold and applied it? Your system just changed — head back to Live Matching to see who qualifies now, or Save a System to keep it.