Metrics (Tour Averages)
The Metrics page is a single reference table of typical values for every stat we track. For a chosen court surface it shows the average of each stat across six groups of players: male and female, each split into three tour levels. It answers the question, "What is normal here?"
Use it as a yardstick. When you see a player's number on a match or player page, this table tells you whether that number is high or low for that level and surface.
It is a slow-moving reference, not live data — no scores, no odds, no single player's figures, just group averages that are kept up to date over time.
Picking a surface

At the top is a Surface selector: All, Hard, Indoor, Clay, Grass. Click one to update the whole table.
- All includes every surface together.
- The others narrow the averages to that one court type.
Surfaces are grouped the same way as everywhere else on the site — for example Indoor covers indoor hard, carpet and acrylic, while Hard means outdoor hard only. See Reading Stats & Filters for the full surface explanation.
Reading the table
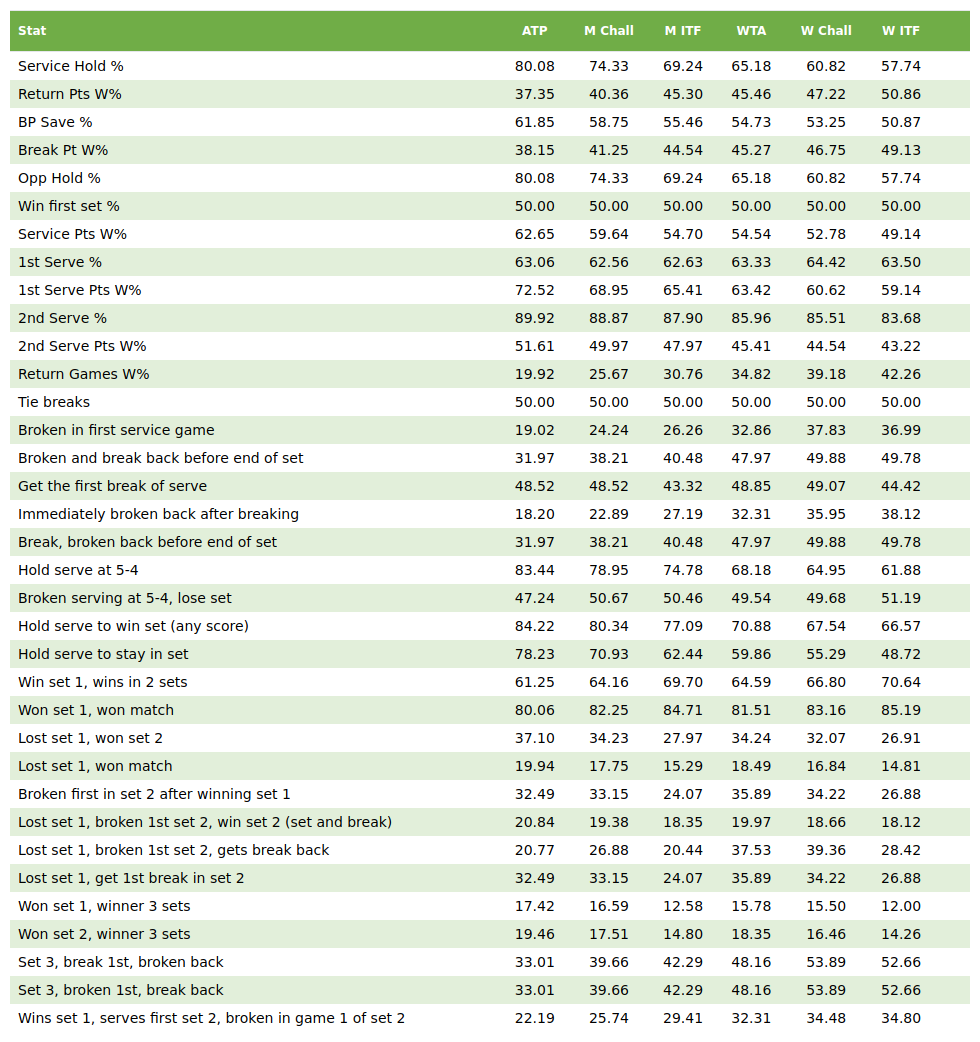
Each row is a stat. Each of the six data columns is a player group:
| Column | Meaning |
|---|---|
| ATP | Men's, main-tour level |
| M Chall | Men's, Challenger level |
| M ITF | Men's, entry level |
| WTA | Women's, main-tour level |
| W Chall | Women's, Challenger level |
| W ITF | Women's, entry level |
So the six columns are simply men's and women's play at three levels.
Rows are grouped exactly like the match-stat sections (Key Statistics, Other Stats, Break of serve, Serving for the set, After set 1, Third sets). Hover over a stat name to see its definition — these are the same definitions used across the site, all collected in the Stat Glossary.
What a number means
Every cell is the average of that stat for that group on the selected surface — the benchmark, not a single player.
Worked example: say men's Challenger players on clay hold serve around a certain percentage. If a specific player shows well above that on their match page, they're an unusually strong holder for that level and surface. That comparison is the whole point of this page.
Most stats are better when higher, but a few are better when lower — for example Opp Hold % is the rate at which opponents held serve, so a low number is good. The Stat Glossary flags which stats read the other way.
Seeing how surfaces differ
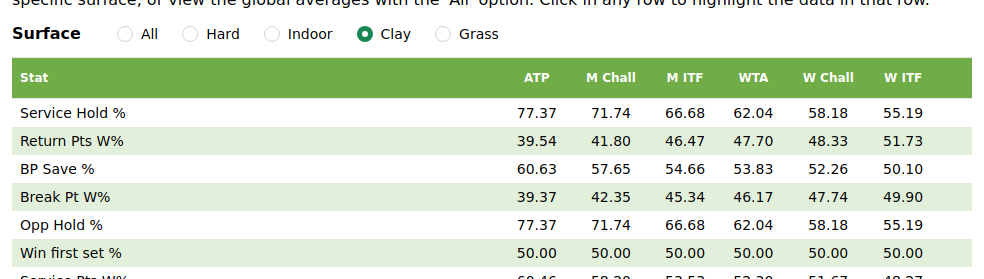
Switch between All and a specific surface to see how the norm shifts. Serve dominance is typically higher on grass and lower on clay, so the same stat has a different "normal" from one surface to the next. Judge a player against the surface they'll actually be playing on.
Tips
- Click any row to highlight it, so your eye can follow that one stat across all six columns. Click again to clear it.
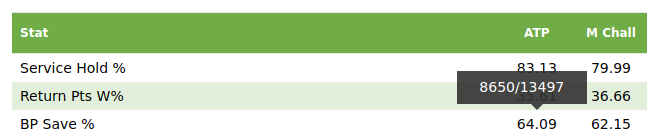
- Hover over a number to see how much data the average is based on.
- Not sure what a stat means? Every name links back to the Stat Glossary.